Should Leverage and Trading Time Frame Correlate? The Math of Leverage, Volatility and Liquidation
On this page
I started crypto margin trading, and I'm not really sure if the length of my trade would impact the amount of leverage I decide to use and how it would affect the amount of risk I would be taking.
The short answer
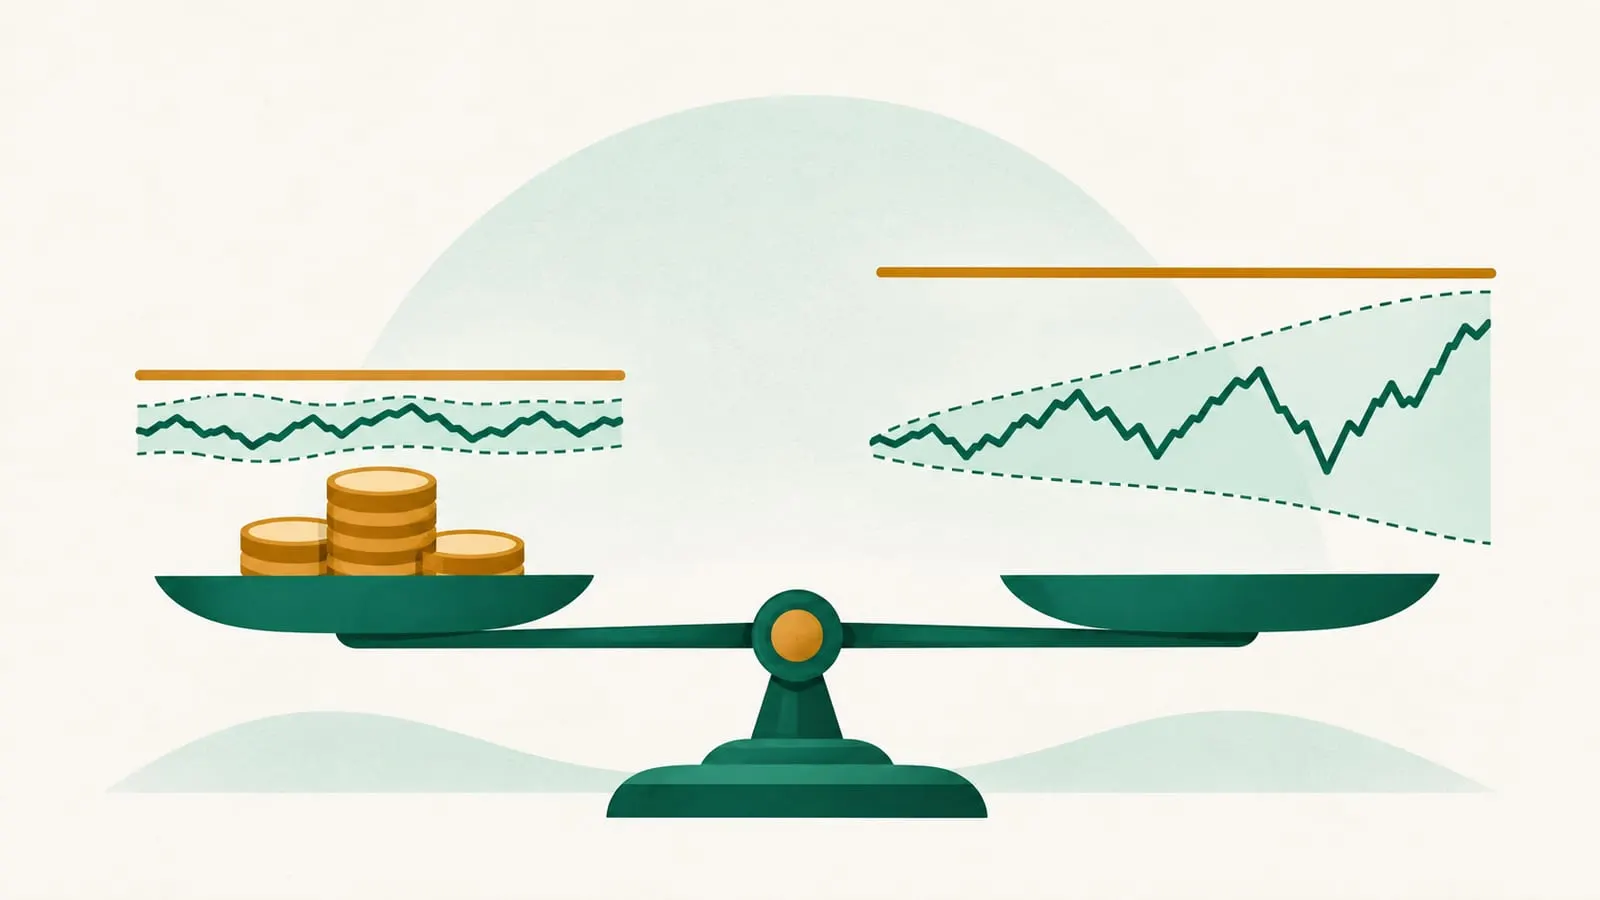
Yes, your leverage and your holding period are linked, but not in the way the old answer on this page suggested. The longer a position stays open, the further the price has time to wander, and the more holding costs eat into your margin. So for the same chance of being liquidated, a longer time frame needs a liquidation price much further away, which means lower leverage.
That does not mean short time frames make high leverage safe. At high leverage, ordinary minute-to-minute volatility is enough to close you out, and fees on the full position take a large share of each small gain. This page explains the math; it is not a recommendation to use leverage at any setting.
Part 1: leverage sets your liquidation distance
Leverage is position size divided by your own margin. At 10x, $1,000 of margin controls a $10,000 position, so a 1% price move is a 10% change in your equity.
Venues close your position when equity falls below the maintenance margin, a small percentage of the position set per market (dYdX and Hyperliquid both define it as a fraction of position value). For an isolated position, the distance to liquidation is approximately:
Liquidation distance ≈ 1 ÷ leverage − maintenance margin rate
With an illustrative maintenance margin of 0.5%:
| Leverage | Margin wiped out by | Approximate liquidation distance |
|---|---|---|
| 2x | 50% | ~49.5% |
| 5x | 20% | ~19.5% |
| 10x | 10% | ~9.5% |
| 20x | 5% | ~4.5% |
| 50x | 2% | ~1.5% |
Fees, funding and the venue’s actual maintenance rate shift these numbers, which is why our forced liquidation entry rounds them to “about 9%” at 10x and “about 4%” at 20x. Always read the liquidation price the venue displays.
Part 2: volatility grows with time
Price ranges don’t grow in a straight line with time. As a rough rule, the typical move over a period scales with the square root of its length:
Typical move over T days ≈ daily volatility × √T
From CoinGecko’s daily closing prices for the 12 months to mid-November 2026, bitcoin’s daily volatility (the standard deviation of daily log returns, close to close) was about 2.3% and ether’s about 3.2%, equivalent to roughly 44% and 60% a year. That gives these typical, one-standard-deviation moves:
| Holding period | Bitcoin | Ether |
|---|---|---|
| 1 day | ~2.3% | ~3.2% |
| 1 week | ~6% | ~8% |
| 1 month (30 days) | ~13% | ~17% |
| 3 months (90 days) | ~22% | ~30% |
Larger moves happen regularly, since crypto returns have fat tails. In 2022 bitcoin fell more than 70% from its November 2021 peak, a drawdown that would have liquidated even a 2x long held through it.
Putting them together: how often the line got hit
Combining the two tables shows the relationship directly. Using the same CoinGecko data, we checked every day of the past year: if you had opened a bitcoin position at that day’s close, how often did a later daily close reach the liquidation distance within the holding period? We counted only start days whose full holding period fits inside the year, so the three-month column rests on about 276 starting days.
| Leverage (distance) | Within 1 day | Within 1 week | Within 1 month | Within 3 months |
|---|---|---|---|---|
| 5x (~19.5%) | 0% | ~1% | ~8–16% | ~40–47% |
| 10x (~9.5%) | 0% | ~4–7% | ~25–37% | ~62–63% |
| 20x (~4.5%) | ~2–4% | ~25–27% | ~49–60% | ~74–81% |
| 50x (~1.5%) | ~18–22% | ~57–62% | ~79–80% | ~88–91% |
Ranges show the long and short side. Read these as a lower bound: they use daily closes, so they miss intraday spikes that liquidate positions in practice, and they ignore fees and funding, which pull the liquidation price closer. They describe one particular year in which bitcoin fell about 30% overall, not a forecast, and the volatility rule above assumes a bell-curve shape that crypto prices don’t follow in the tails.
The pattern is the point. A leverage level that rarely got hit within a day was hit a quarter to a third of the time within a month and most of the time within three months.
Part 3: holding costs scale with leverage and time
Leveraged positions pay to stay open. On spot margin you pay borrow interest; on perpetual futures you pay or receive funding. Both are charged on the full position, not your margin.
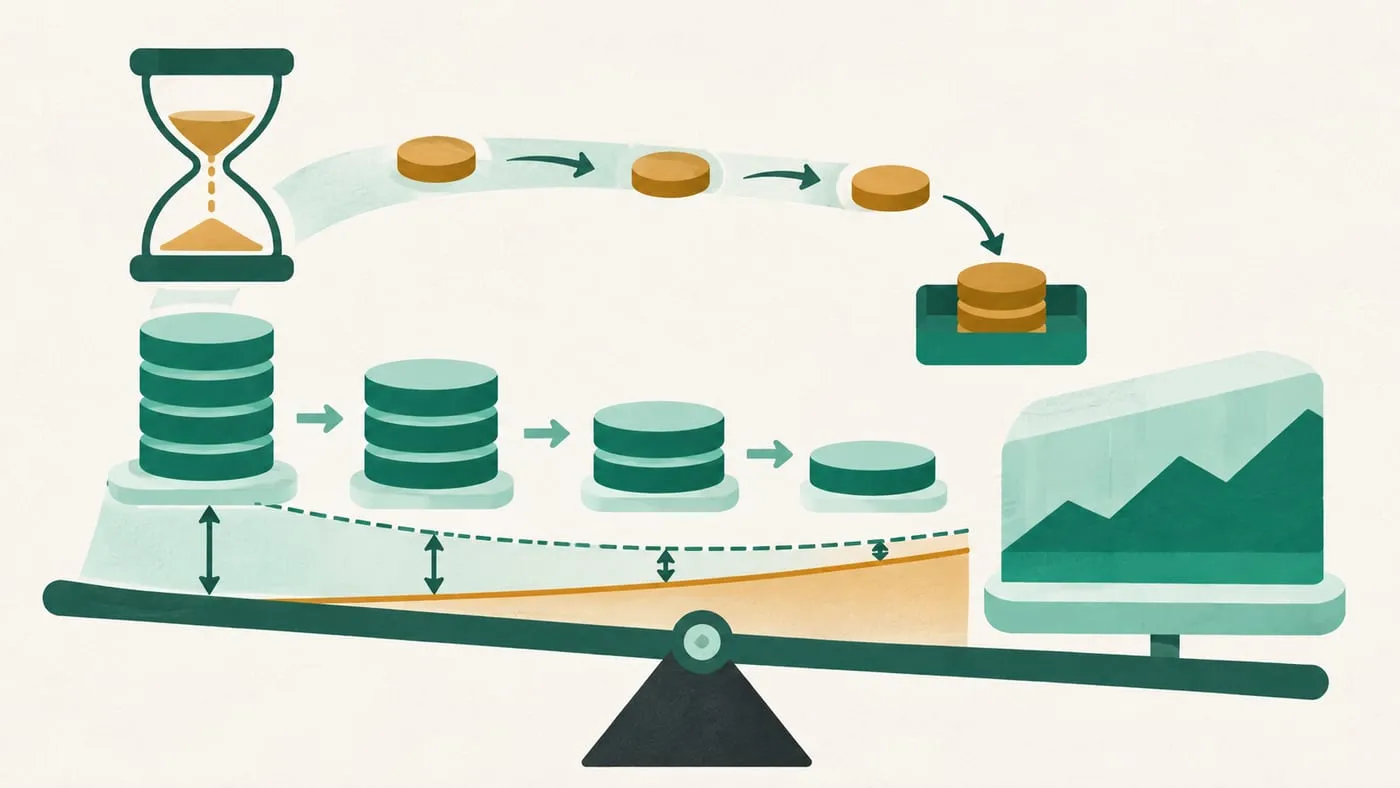
Hyperliquid’s documentation, for example, sets a baseline interest component of 0.01% every eight hours, about 11% a year before compounding, which it describes as 11.6% APR paid to shorts when the market is otherwise balanced. Actual funding moves with demand, can flip sign and is capped at 0.5% per hour. At that baseline, a long pays about:
- 2x: roughly 22–23% of its margin per year
- 5x: roughly 55–58% of its margin per year
- 10x: roughly 110–116% of its margin per year
Every payment reduces margin and moves your liquidation price closer. A position that was a safe distance away on day one can drift into danger over weeks even if the price goes nowhere. See what the interest rate on margin trading is and how funding works in perpetual contracts.
Why “high leverage on short time frames” isn’t the fix
The old answer recommended high leverage on 1- to 15-minute charts for scalping. Short holds limit the time for price to travel, but:
- At 50x, the liquidation distance (~1.5%) is smaller than an ordinary day’s move in bitcoin, and intraday swings are larger than closes suggest.
- Trading fees are charged on the full leveraged position, so a round trip at high leverage costs a large share of your margin before price moves. Our page on high leverage with a scalping strategy works through those numbers.
- Short time frames mean more trades, so costs and mistakes compound.
How risk is actually measured
Leverage tells you how close liquidation is. It does not tell you how much money you are risking. Professionals think in risk per trade: the amount lost if the trade hits its exit, as a share of the account. Two practical consequences:
- Higher volatility or a longer hold means wider exits, which means a smaller position for the same money at risk.
- Your exit, such as a stop-loss order, should sit well before the liquidation price, not beyond it. A stop is not guaranteed in a gap.
For working through margin numbers, see how to determine the collateral required to leverage a crypto trade.
Risks
- Most leveraged retail traders lose money. National regulators’ data cited by ESMA in 2018 found 74–89% of retail CFD accounts typically lose money, and ESMA capped retail crypto CFD leverage at 2:1.
- Liquidations cluster. CoinGlass counted about $73.4 billion of liquidations across its sample of exchanges in the first half of 2026. Cascades can push price through many liquidation levels in minutes.
- Past volatility is not future volatility. The figures above describe one year and can change sharply.
- Platform and legal risk. Venues can fail, freeze withdrawals or bar your country. Check legality first; our guide to trading crypto futures covers the US rules.
The only position that can’t be liquidated is one without borrowed money. If you are deciding how much leverage to use, the math above is an argument for using less, or none.
Frequently asked questions
What leverage is safe for a long-term trade?
No leverage level is safe. For a given holding period you can estimate how often the price has moved as far as your liquidation distance, and the longer the period, the further away that distance has to be to make liquidation unlikely. Unleveraged spot holdings cannot be liquidated.
Is high leverage OK for scalping on short time frames?
Short holds limit how far price can travel, but at 50x a move of about 1.5% liquidates you, and bitcoin closed at least that far against a position within a single day on about one in five days over the past year. Fees on the full position also eat most small gains.
Does leverage determine my risk?
Leverage sets how close your liquidation price is. Your actual risk is how much of your account you can lose on the trade, which depends on position size, where you exit, and costs. A small position at high leverage can risk less money than a large one at low leverage, but it is still liquidated by a smaller move.
Why does my liquidation price move while I hold a perpetual?
Funding payments, borrow interest and fees are taken from your margin over time. As margin shrinks, the liquidation price moves closer to the current price, even if the market hasn't moved.
Sources
Educational content, not financial advice. DeFi carries risk, including total loss of funds.